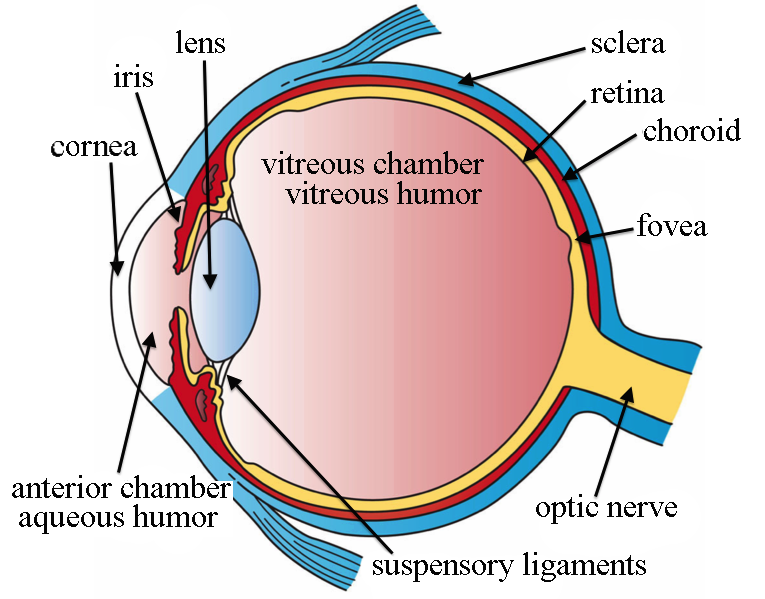
The human eye largely consists of two parts: an anterior cavity which directs light by refracting it, and a posterior cavity which transduces light by turning it into a neuronal signal.
The eye would be a near-perfect sphere if not for the bulge on the anterior cavity known as the cornea. This transparent bulge on the surface of the eye is responsible for focusing light inwards through the pupil, a hole which is expanded and contracted by the iris in order to allow more or less total light to come through. (To reiterate, because it's surprising, the pupil is not a physical entity — it's the name of a hole into the eye). The rest of the surface is comprised of the sclera, or “white” of the eye.
After passing through the pupil, light hits the lens of the eye, a transparent structure which again focuses light inwards. While this structure is weaker than the cornea, it can increase or decrease its convexity so as to change the distance at which the eye focuses, or the eye's focal length.
Light now enters the posterior cavity, traveling through the transparent, gel-like vitreous humor whose primary function is maintaining the shape of the eye; once light has traveled to the very back of the eye, it hits the retina, the part of the eye where light is turned into signals.
The retina is very wide, spanning about three quarters of the interior surface of the eye, and contains no less than ten distinct layers. At the back of the retina are the actual photoreceptors. There are two kinds of photoreceptors, each of which responds to light by reducing its activity.
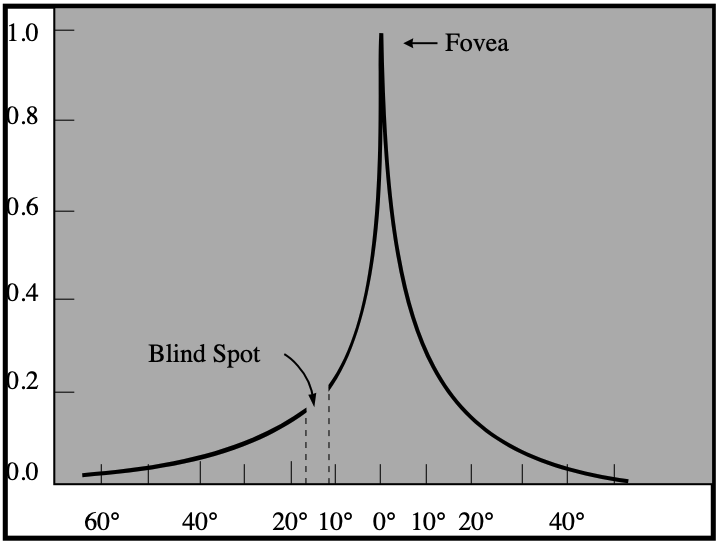
Both the the density of cones of a specific color and the number of cones that converge on a single transducer neuron vary widely throughout the retina — in one particular spot very close to the center of the retina, known as the fovea, every cone gets its very own ganglion, and the density of (primarily red and green) cones increases greatly. There are, however, no rods in the fovea, as shown in the image below.
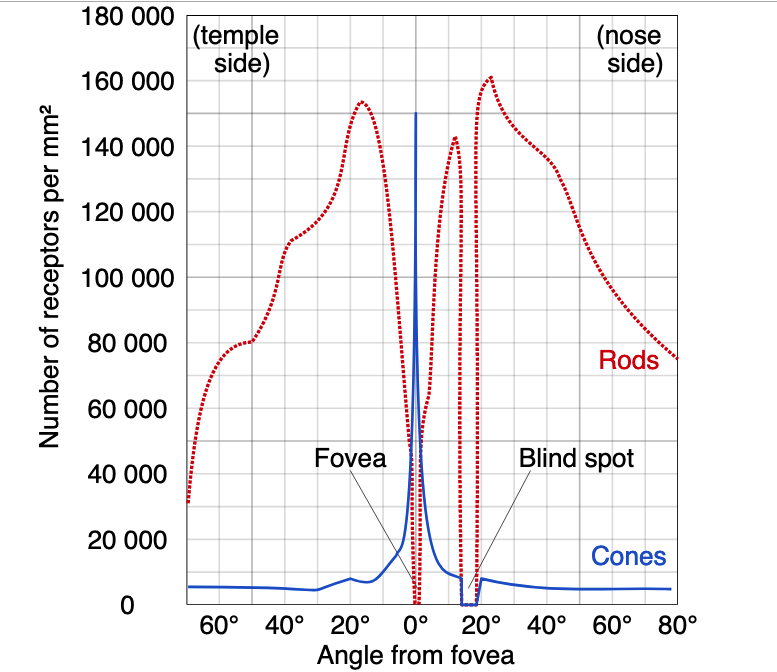
Rods are responsible for most vision in low-light conditions, due to their sensitivity and increased number (about 120 million rods compared to 6 million cones), but it is the cones that are most responsible for vision in all other cases. Strangely enough, after a signal is generated by rods and cones, neurons carry it towards the front (anterior) of the retina, with the axons of the neurons in the frontmost layer, also known as retinal ganglionic neurons, bundling together at a certain point to form the optic nerve, which delivers retinal information to the brain. Because the axons start in the frontmost layer, the optic nerve must penetrate through the retina in order to leave through the back of the eye; this creates a gap where light cannot be processed, known as the physiological blind spot.
Note: Some retinal ganglionic neurons are actually photosensitive in themselves; these intrinsically photosensitive retinal ganglionic neurons, which are primarily responsive to blue light, project to a small region of the hypothalamus known as the suprachiasmatic nucleus; here, they help maintain circadian rhythms. Since they don't aid vision itself, they're not relevant to us, but I thought they were interesting enough to be worth mentioning.
The purpose of the human eye is, ultimately, to gather optical information from wherever it is made to point. To this extent, it has some of the common features present in optical systems:
Here, we'll expound on some of the basic properties of optical systems, applying them to the eye to understand how exactly it takes in light.
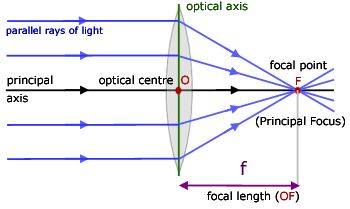
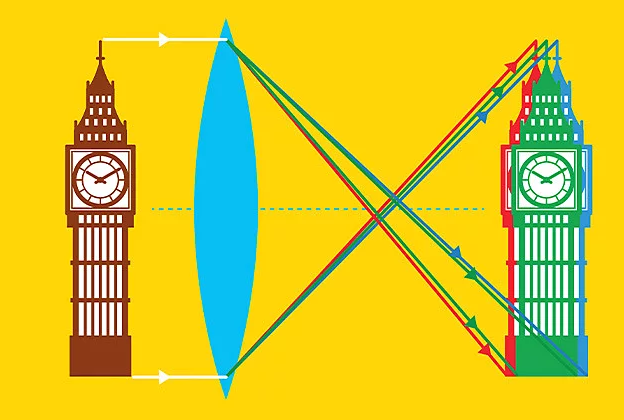
An ideal convex lens bends beams of light inwards such that all rays of light emerging from a particular point will be sent to a single point on the other side of the lens. Thus, if we look through the lens, every point in our vision will correspond to a unique point on the other side of the lens, making the image we see a resized, and perhaps flipped, but otherwise ideal version of reality.
In the limit, when the light source is infinitely far along the rotational axis of symmetry of the lens (the optic axis), these rays will be lines parallel to the axis; the single point the lens makes them converge to is known as the focal point of the lens.
The distance between (a certain, canonically defined plane within) the lens and the focal point is known as the focal length, and the inverse of the focal length the optical power. The optical power of a lens, measured in inverse meters (often called diopters), is a measure of how powerfully the lens bends light; the optical powers of combined lenses roughly add, making analysis easy.
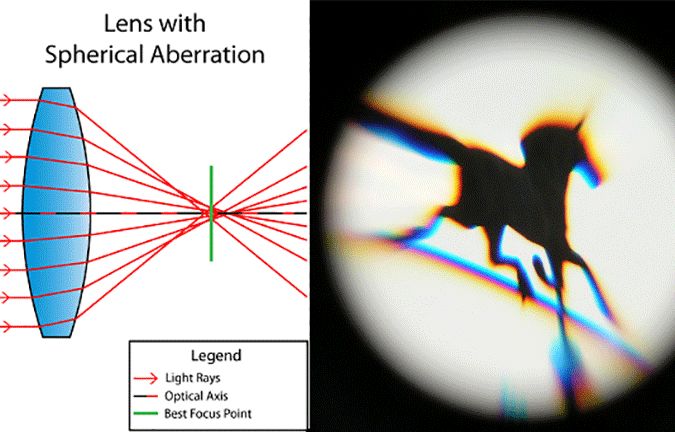
For non-ideal lenses, this breaks down in several ways, these ways being known as optical aberrations. The three most common examples are:
In a human with normal eyesight, the optical power of the cornea will be a fixed 43 diopters. The lens, being dynamic, will have an optical power range, also known as an amplitude of accommodation. The minimum accommodation is zero, while the maximum accommodation varies with age — in children and teenagers, this can be as high as 16, but gradually decreases to 1 over the following decades. Because higher optical power means a focus closer to the eyes, this age-related decrease results in a steady decrease in ability to focus on nearby objects, a phenomenon known as presbyopia.
While this isn't a form of aberration per se, the human eye can display many kinds of aberration. For instance, it displays a slight chromatic aberration, with red light being refracted with an optical power two diopters above blue light. This effect is almost always filtered from perception by neural processing, but there are cases in which the brain misinterprets the difference as corresponding to something real.
For instance, in the curious phenomenon of chromostereopsis, when a blue shape is placed directly next to a red one, the brain will interpret this difference as a difference in depths between the red and blue shapes.
Most people will see red as being above blue, which is predictable from the association of higher diopters with closer focuses, but some people see no difference or the opposite effect, an oddity purportedly explained by the Stiles-Crawford effect.

The eye has a very small spherical aberration of +0.10 µm, given by the sum of the +0.30 µm aberration of the cornea plus the -0.20 µm aberration of the lens. Since spherical aberration primarily affects the peripheral parts of an image, the spherical aberration of the eye is generally hidden by the fact that peripheral vision is already so blurry. Low-light vision, however, is far more dependent on peripheral vision, causing high spherical aberration to translate to myopia, or nearsightedness.
Astigmatism is, when it occurs in the eye, commonly known as astigmatism. (I'm veeery thorough). As astigmatism is caused by a difference in focus along different axes. These axes may be perpendicular, known as regular astigmatism, or they may not.
Given that all light which the brain employs to construct a visual field is detected by rods and cones, the structure and detail of the entire visual field depends largely on the distribution of the rods and cones throughout the retina. To talk about the visual field precisely, we need to figure out how to parametrize it, so that we may talk about the coordinates of any given point in the field.
Generally, we parametrize this visual field by using spherical coordinates over Euclidean space, centering these coordinates either on one eye (if we are speaking of the visual field available to that eye alone), or between the eyes (if we are speaking of the entire visual field). With one eye, we speak of the monocular visual field; with two eyes, the binocular visual field.
These spherical coordinates, as usual, consist of an azimuthal angle $\varphi$ describing horizontal position and an an altitude, or elevation angle $\theta$, describing vertical position. We drop the radius.
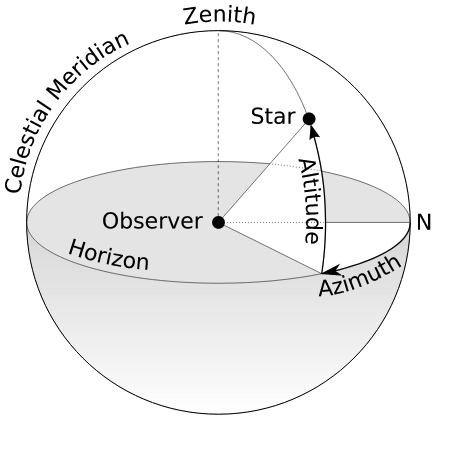
To finalize this model, we need to choose an axis to serve as the origin, such that points along this axis have coordinates $(\varphi, \theta) = (0, 0)$. Because the fovea, the point of clearest perception, is not identical to the exact direction of the pupil, we need to make a choice: we could either set our axis to align with the fovea, such that the origin consists of those points we see the most clearly, or to align with the center of the pupil, such that the origin consists of those points which our pupils are focused exactly on. Choosing the fovea gives us the visual axis, while choosing the pupil gives us the optical axis. By convention, we will choose the former.
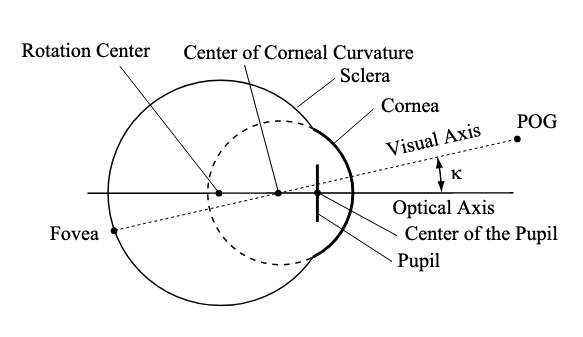
The angle between the visual and optical axes is known as $\kappa$, and, according to this paper is anywhere between 3° to 6° — worryingly, it seems to depend on the machine used to measure it.
An example of angles that you can try out: Hold a rod or stick of length $\ell$ at arm's length $a$ and parallel to your eyes, using your right eye to stare at the left end. In cartesian coordinates with $x$ the foveal axis, $y$ going horizontally, and $z$ going vertically, the right end of the object will be at $(a, \ell, 0)$; in spherical coordinates, $\varphi = \tan^{-1}(\ell/a)$, while $\theta = 0$. For instance, if your arm's length is 25 inches and the object you're holding is a ruler with 0” on the left, the 1” marker will be at 2.3°, the 6” marker at 13.5°, and the 12” marker at 25.6°.
Note that the angle does not increase linearly — this is because the further a point is on the ruler, the further away it is from you, and the rate of change of angles with respect to the rate of change of cartesian coordinates decreases rapidly as the radius increases. In this case, where the only angle we care about is $\varphi$ and the only cartesian coordinate we care about is $\ell$, we have $\frac{d\varphi}{d\ell} = \frac{1}{a} \left(\frac{1}{1+\ell^2}\right)$.
There is one common rule of thumb for guesstimating degrees: stick your (literal) thumb out at arm's length, and look at its knuckle — the width of this knuckle will be approximately 2°.
Having parametrized the visual field, we're now in a position to discuss its resolution and size.
The visual acuity of a given point in the visual field is defined as follows: find the smallest angle, in arc minutes (sixtieths of a degree), at which one is able to discern details at that point, and then take the reciprocal of that angle. For instance, if I can only tell the letter F from the letter P when it's no more than a certain distance away from me, my visual acuity would be the reciprocal of the angle of my visual field spanned by the single stroke distinguishing F from P when the letter is at that distance. Often, this is expressed as a fraction with a fixed numerator — Americans like to use 20. If I need the stroke to span 4 arc minutes when the letter is at a given point in my visual field, for instance, then my visual acuity at that point is 1/4, or 20/80.
In normal lighting conditions, the point of highest visual acuity will obviously lie along the visual axis (and therefore register at the fovea, which has the highest concentration of cones). In low light, however, the rods are the primary contributors to vision, and the absence of rods in the fovea causes the point of highest visual acuity to diverge from the visual axis.
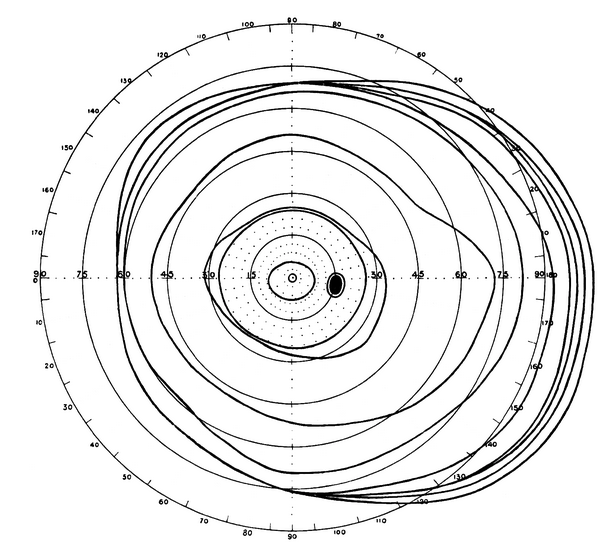
The range of the monocular visual field varies from person to person, but can extend 110° towards the temple (so left for the left eye and right for the right eye), 60° towards the nose, 80° downwards, and 70° upwards. These are generous numbers, and some sources report slightly smaller numbers. Hence, we have up to 220° of horizontal vision, 120° of binocular vision, and 150° of vertical vision.
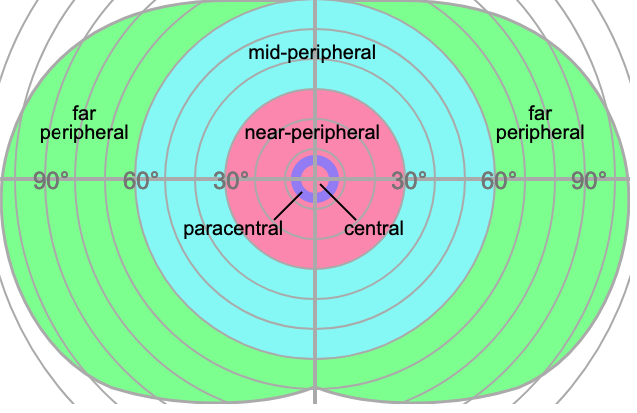
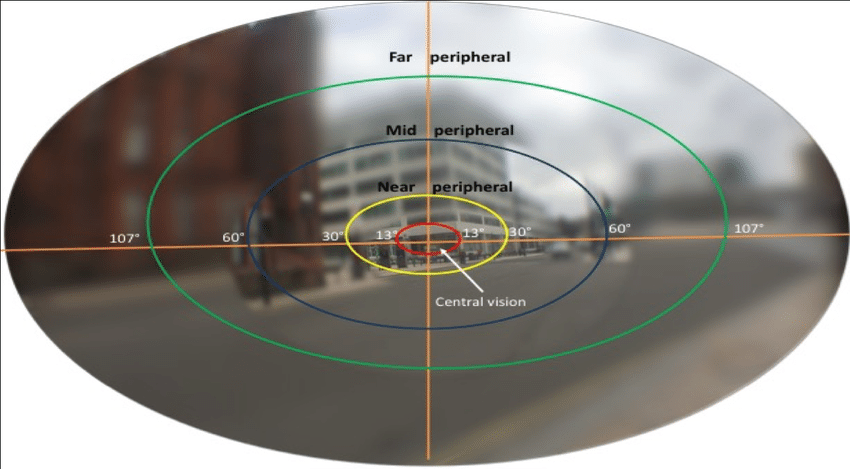
The visual field is generally divided into multiple parts — a central region extending 5° from the fovea, a near-peripheral region extending from 5°-15° to 30° out (definitions vary), a mid-peripheral region extending from 30° to 60° out, and a far peripheral region extending from 60° out to the ends of the visual field.
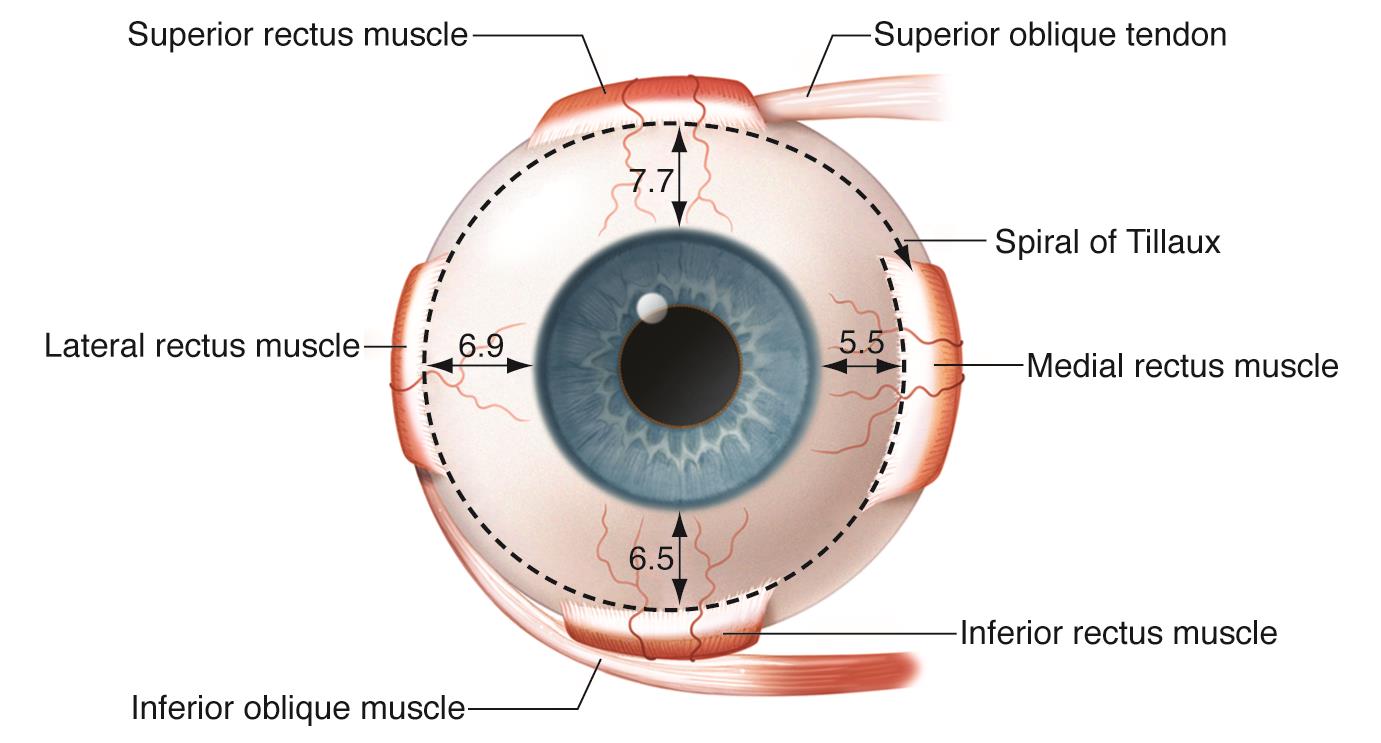
Each eye is controlled by twelve muscles, of which three are intraocular, seven are extraocular, and three are for the eyelids. Most of these muscles come in antagonistic pairs — this is a very common pattern in muscular organization whereby each member of the pair acts on the same object, but in opposite directions; each acts to slow down and control the action of the other, this push-and-pull allowing a great amount of control over the motion of whatever it is that the antagonistic pair moves.
The ten extraocular muscles are as follows:
The three intraocular muscles are as follows:
.svg.png)
These muscles, acting in tandem, give us tools to control what we see in a dynamic world. The main consideration here is getting both our foveae on the object we wish to focus on as fast as possible, so we can see it clearly and with depth perception.
1. Saccadic Movement
Most movements of the eye are rapid jerks. These jerks are known as saccades (French for “jerk”, rhymes with “maraud”), and allow us to switch our vision from one fixed point to another fixed point; when below 2°, as often happens in reading, they are known as microsaccades. The velocity at which the eyes move during saccades is variable, but tends to increase as the saccade length gets higher, in most subjects reaching up to 500°/second around 20°. (If the distance between focus points is larger than this, a head movement will generally occur simultaneously). This speed makes saccades among the fastest movements made by the human body relative to their size.
During a saccade, most visual stimuli are blocked, preventing you from noticing the extremely blurry movement of the scene; this is known as saccadic masking. For instance, you generally can't see your eyes performing a saccade when looking in a mirror. There's one curious exception to this — when the environment is moving such that there is no motion blur during part of the saccade, such as when there happens to be a pattern moving as fast as the saccade along its route, that intrasaccadic perception ends up as a seen image.
2. Smooth Pursuit
In contrast to the sudden jerking of saccades is the continuous movement of smooth pursuit, a type of movement in which the eyes follow some object, for instance a paper plane, as it moves across the visual field. It's generally difficult to do this completely voluntarily, without an object to follow, but can easily be done if you create an object to follow, for instance by holding your finger up and looking at it while moving it around. This involves not only the six extraocular muscles of each eye, but the ciliary muscles as well, which autonomously and smoothly adjust the lenses of the eyes to maintain the correct distance of focus as the object moves towards or away from the viewer.
3. The Optokinetic Response
When a smooth pursuit is ended by the object leaving the field of vision, the eyes will often saccade back to the position they were in before they began the pursuit. For instance, if when watching fireworks you track one particularly bright spark as it flies away, when it eventually leaves your field of vision you will likely find yourself automatically snapping back to the center of the display. This is known as the optokinetic response.
4. The Accommodation Reflex
When the point of view suddenly changes from near to far or vice-versa, the focus distance must immediately change to accommodate it. This happens via the accommodation reflex, a rapid tightening or loosening of the ciliary muscles that control the lenses of the eyes. Since more convex lenses increase the spread of light across the retina, this reflex also involves a contraction of the pupil, so that light coming in from the edges of the cornea does not become overwhelming.
5. The Vestibo-Ocular Reflex
When you move your head while looking at something, your eyes (and lenses) move opposite to your head in order to keep looking at the same spot. If you lean to the left while reading this, for instance, your eyes will automatically and smoothly move to the right, the outcome being that the head movement has no effect on your vision. This is known as the vestibo-ocular reflex, and can happen in under 10 milliseconds, making it one of the fastest among all human reflexes.
6. The Pupillary Light Reflex
Shine a light in someone's eye, their pupils dilate. This is known as the pupillary light reflex, and amounts to the control of the pupil size via the iris sphincter and dilator muscles so as to prevent the seen image from being too bright or too dim — as anyone who's ever had their eyes chemically dilated knows, excessive light entering the eyes can render clear vision almost impossible, and is extremely unpleasant besides.
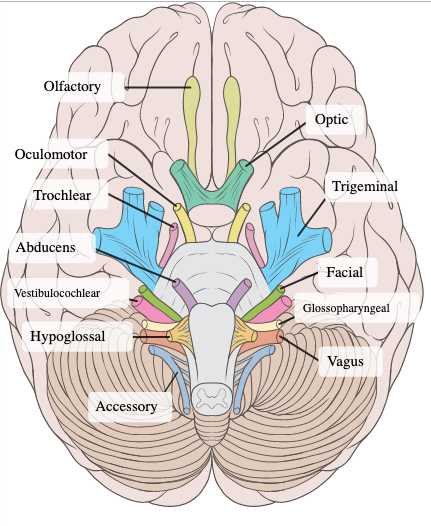
All neural information entering or exiting the brain must pass either through the spine or through one of precisely twenty-six bridges. These bridges come in the form of thirteen pairs of cranial nerves, which attach to the brain near its bottom. (Sometimes each pair is considered to be one nerve, symmetry being assumed — for the most part, this won't affect our discussion).
The image on the right shows twelve of the thirteen pairs of nerves — the missing one is the terminal nerve, which may have a role in pheromone sensation, but is for the most part tiny and useless.
We're interested in the optic nerve; being second in the classical enumeration of the cranial nerves, it is commonly called cranial nerve (CN) II.
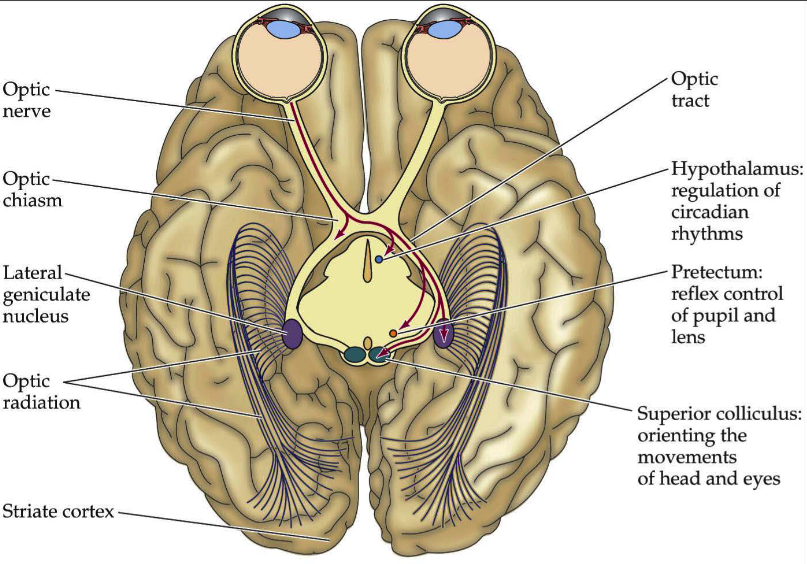
The left and right optic nerves carry data from the retina to the underside of the brain — they do not connect to the brain here, instead recombining at the optic chiasm. Going in, the left input to the optic chiasm contains the left and right sides of the left eye, while the right input contains the left and right sides of the right eye; after recombining, they leave the optic chiasm along two optic tracts. The optic tract on the left now contains the right side of both eyes, while the optic tract on the right now contains the left side of both eyes.
The end result is that the left side of the brain processes the entirety of the right visual field, while the right side processes the left visual field. Stereopsis would not be possible without this recombination, as each eye's data would be processed separately, rather than compared with one another. However, it could've still sent the left visual field to the left hemisphere and vice-versa.
It's not currently known why the brain is twisted in this manner (not just for vision, but for the entire body), but the dominant theory seems to be the axial twist hypothesis.
After leaving the chiasm via the optic tracts, neurons split up to project to no less than four separate regions of the brain: the lateral geniculate nucleus (LGN), superior colliculus (SC), suprachiasmatic nucleus (SCN), and pretectal area (PA), often called the pretectum. The locations of these endpoints are shown below.
The suprachiasmatic nucleus only receives that optic nerve data which comes from the intrinsically photosensitive retinal ganglion cells in the retina; as such, the SCN isn't related to vision, and we'll ignore it. On the other hand, the pathways taken by these ganglion cells, collectively known as the retinohypothalamic tract, project not to the SCN, but to other parts of the brain, some of which are relevant to vision. In subjects whose rods and cones have been wiped out, they seem to help modulate the pupillary light reflex and help faintly guide light-related behavior, though it's not clear if this is an adaptation.
When discussing the flow of neural signals, a distinction is made between afferent movement, from the body into the nervous system, and efferent movement, from the nervous system to the body. Afferent movement is generally the body “informing” the nervous system of sensory data, and efferent movement is generally the nervous system “controlling” the body by activating muscles or glands. Mnemonically, afferent arrives and efferent exits [the brain].
As regards vision, the main afferent pathway is the optic nerve, which sends data from the eyes to the brain. There are nearby afferent pathways — when you get poked in the eye, for instance, it's the trigeminal nerve (cranial nerve V) which conveys the sense of pain — but these are unrelated to vision itself.
The efferent pathways which send data from the brain to the eye consist of four cranial nerves. Since cranial nerve VII, the facial nerve, controls the closing of the eyelids only for the purposes of facial expression, we'll ignore it. Two of the other three nerves are oddities:
The main efferent pathway is cranial nerve III, the oculomotor nerve. This controls the superior rectus (eye up), levator palpebrae superioris (eyelid up), superior tarsal muscle (accessory eyelid up), medial rectus (eye inwards), inferior rectus (eye down), inferior oblique (eye rotates inwards), and, via a particular section known as the Edinger-Westphal nucleus, controls the ciliary muscle (controlling lens focus) and the iris sphincter and dilator muscles (controlling pupil size).
The methods in which parts of the brain control the movements of the eye previously discussed are as follows:
Pretectum: The pretectum seems to be associated primarily with control of smooth non-positional movements and minor corrections to smooth positional movements. It mediates the pupillary light reflex by gradually activating and deactivating the iris sphincter and dilator muscles in response to varying light levels, it aids in smooth pursuit by cleaning up small errors in the tracking motion, helps control the optokinetic reflex, it helps vary the curvature of the lens in order to maintain an accurate focus, thus aiding in the accommodation reflex.
Supraoculomotor Nucleus: A small section directly above the origin of the oculomotor nerve, known as the supraoculomotor nucleus, also aids in the accommodation reflex — when higher visual processing centers determine that the vision is out of focus, they signal this area, which then directly sends commands through the oculomotor nerve.
Vestibular System: The vestibulo-ocular reflex, or the adjustment of the eyes to counteract head movement, is an oddity, in that it doesn't start with visual information — rather, structures in the inner ear detect head movement, which is then translated into inverse eye movement and sent through the oculomotor nerve to move the eyes.
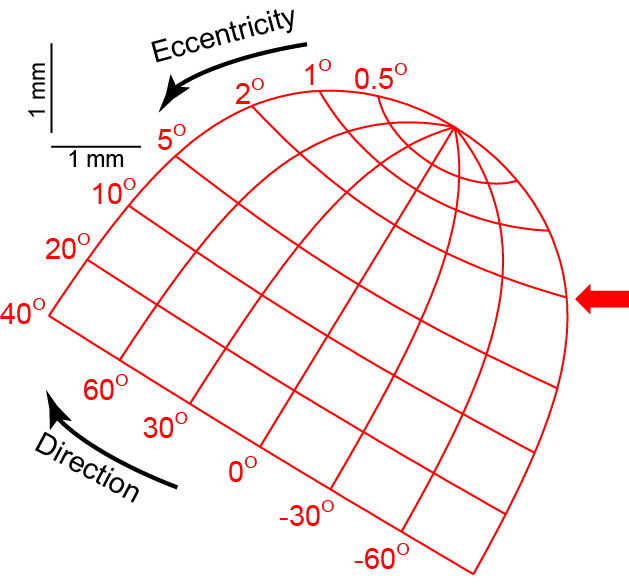
Superior Colliculus: This is a very interesting system, and we'll take some time to expound on it. This part of the midbrain is composed of seven layers, each of which contains a section spatially corresponding to the retina, such that each point on this section corresponds to a specific point on the visual field.
Such a map is known as a retinotopic map; they're a common theme in the neural processing of vision, and we'll see more. As usual, there's a left and a right superior colliculus; due to the crossing of visual field information, each side contains a retinotopic map of the opposite side of the visual field.
In the deepest two layers of the SC, activity on the map seems to correspond to both saccadic movement and smooth pursuit. Smooth pursuits are guided by neural activity near the peak of the map, corresponding to the fovea (note how incredibly large this region is on the map relative to its size within the visual field), the direction of the pursuit varying with the location of the activity. Saccades, on the other hand, are caused by buildups of activity around the point on the retinotopic map corresponding to the destination of the saccade.
At these same levels, the SC receives information from the ears and other senses, while it receives information from higher visual processing center at its higher levels; it outputs signals not only to the eye muscles but to parts of the brain involved in organizing motor input, most notably head movement. It's thought that one of the main functions of the SC is integrating information from all sensory domains in order to find and move the eyes and head towards objects of interest, as when we hear a sudden, mysterious noise somewhere to our side and instinctively turn our heads and eyes to look at the perceived source of the noise.
There's a significantly more obscure part of the brain to which visual data travels from the SC — the pulvinar nucleus. It seems to play more or less the same role as the SC, guiding our eye movements towards objects of interest, but only for objects in the peripheral vision. For instance, if we're sitting alone at home and a shadow begins to move in our peripheral vision, the pulvinar nucleus may guide our head and eyes towards that thing, so as to see what exactly it is and if it needs acting upon.
There are four main parts of the brain to which the optic nerve projects: the suprachiasmatic nucleus, pretectum, superior colliculus, and lateral geniculate nucleus. We've covered the (ir)relevance of vision to the SCN, the eye movement-adjusting function of the pretectum, and the eye movement-planning function of the SC. Taken together, these form the endpoint of a measly 10% of neurons in the optic nerve.
The other 90% of neurons, after passing through the optic chiasm and entering the optic tract, end in the lateral geniculate nucleus. This is where actual visual processing — the analysis and extraction of things and properties from visual data — begins.
In the optic chiasm, each half of each eye was sent to the contralateral side of the brain — left half of left eye and left half of right eye to right optic tract, right half of left eye and right half of right eye to left optic tract. In the LGN, we'll cross these streams yet again.
The LGN is commonly considered to consist of six layers:
By closeness to the optic tract, then, these six layers are organized as L1 = (K1+M1), L2 = (K2+M2), L3 = (K3+P3), L4 = (K4+P4), L5 = (K5+P5), L6 = (K6+P6).
The crossing of streams is as follows: in, say, the right LGN, the left eye's left visual field will be split among layers 1, 4, and 6, whereas the right eye's left visual field will be split among layers 2, 3, and 5.
Hence, each pair (L1+L2), (L3+L4), (L5+L6) will get a full picture of the left side of the visual field. This hopelessly complicated situation is described in the diagram to the right.
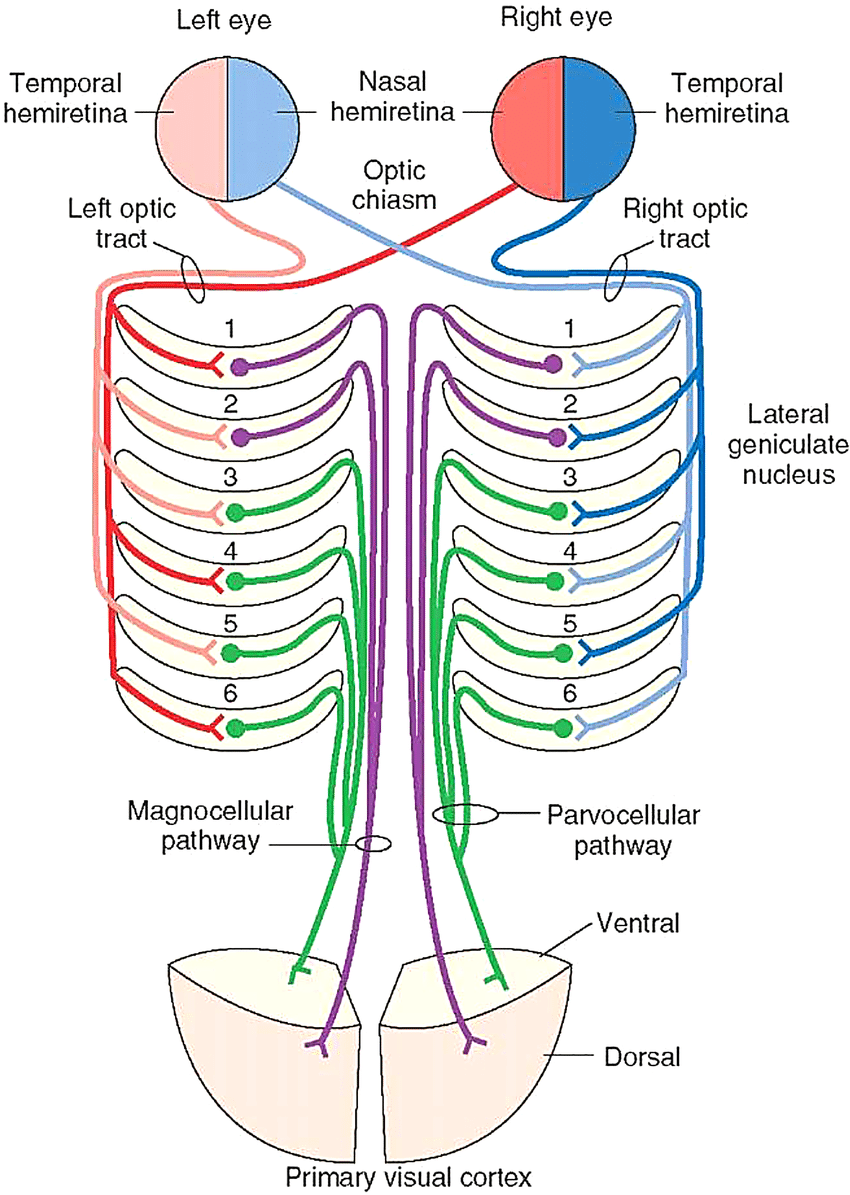
While unpleasant to unravel, this is natural if the LGN is to accomplish what we believe is its mission, the calculation of correlations in intensity and color across space and time. It should be emphasized just how unclear we are about this: the magnocellular layers are somewhat well-characterized, but the function of the parvocellular layers is far less clear, and the koniocellular layers are total mysteries. To make the situation even worse, the LGN doesn't act solely, or even primarily, on optical tract input: 90% of its inputs come from other parts of the brain resulting in visual processing, and are thought to serve a significant modulatory role. We have no idea what's going on here. Anyway, the archetypal model of this calculation of correlations is the opponent process model of color vision, so we may as well go over that.
In the retina, the three types of cone cells do not respond solely to blue, green, and red colors; they have significant overlap, as shown in the image to the right.
Hence, we often refer to them as S, M, and L cones, so as not to confuse ourselves — the letters here stand for wavelengths, with S preferentially responding to short wavelengths of light, M to medium wavelengths, and L for long wavelengths.
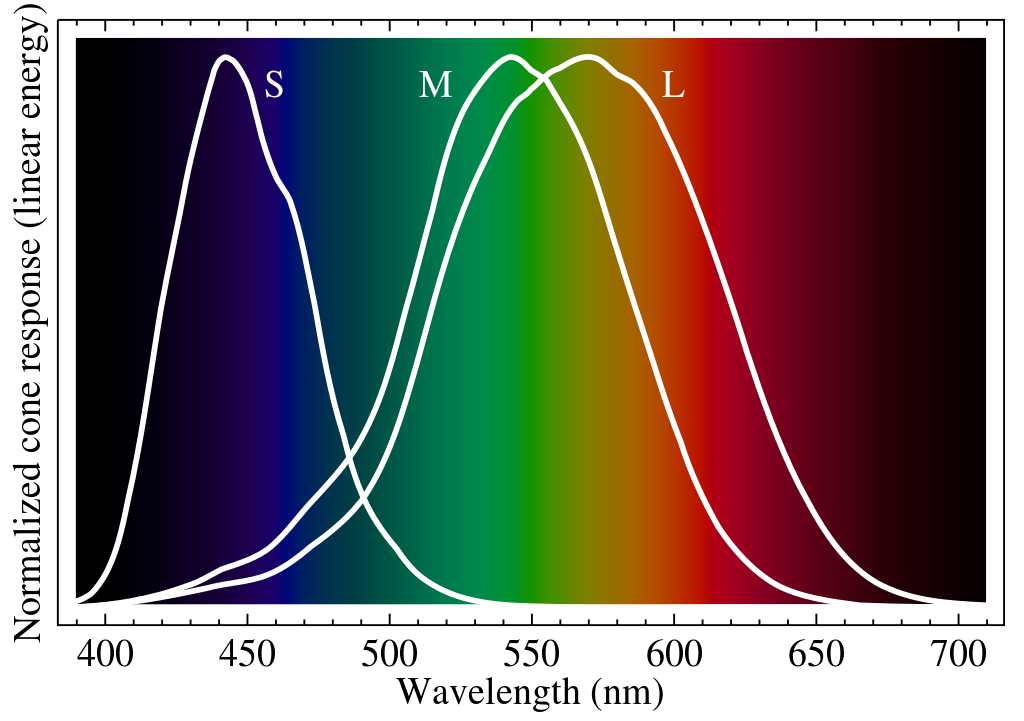
Given how wide these ranges are, and how close the red and green response curves are, how can we so clearly perceive colors? It's usually accepted that this perception involves some sort of opponent process, whereby certain combinations of cone values are compared against other combinations of cone values, the difference between the two combinations being what is sent down to higher visual processing layers and eventually experienced as color. Nevertheless, there's still a lot of debate over what exactly these combinations are, where and how exactly their formation from base S, L, and M cone activities happens, and where and how the differences are taken.
One example of a typical opponent process model, which almost certainly doesn't get all the details right, goes as follows:
Of those retinal ganglion cells which receive information from cones, some are color-opponent ganglion cells. There are a couple types of these: (1) excited by L, inhibited by M, (2) excited by M, inhibited by L, (3) excited by L, M, inhibited by S, (4) excited by S, inhibited by L, M.
To get the idea, let's examine type 1. A ganglion of this type is activated when its population of cones displays more L activation than M activation. By varying the ratio of L to M cones in this population and the excitatory/inhibitory strengths of these cones, we can find ganglions that are activated by as rosy a red as we want. Just as ganglions of type 1 can be made to detect a precise red, so can ganglions of type 2 be made to detect a precise green.
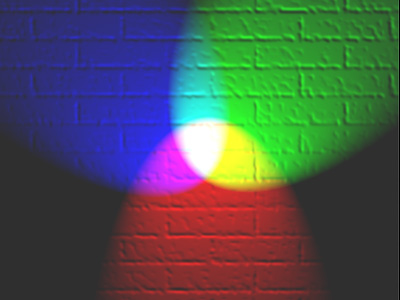
The idea behind types 3 and 4 is this — light combines its colors additively, so red and green create yellow rather than gray. Hence, exciting a ganglion by L and M, and inhibiting it by S, gives us a ganglion capable of detecting red + green = yellow, whereas exciting a ganglion by S and inhibiting it by L and M gives us a ganglion capable of detecting blue.
Hence, this is what happens in the retina: these four populations of color-opponent ganglion cells carry values of red, green, yellow, and blue, respectively. The red and green signals from each half-visual field are sent to the fourth and third parvocellular layers of the LGN, while the yellow and blue signals from each half-visual field are sent to the fifth and sixth layers of the LGN. (Non-color data, such as that coming from rods, is sent to the first and second magnocellular layers, and is irrelevant). Red/green and yellow/blue are both opposing pairs of colors, so the LGN can refine color data further, but its main function at this point is to detect edges based on color changes.
Again, most of the details in the above model are intensely controversial; we still don't really know how color vision works. Perhaps the biggest question is the role of the LGN: it's known that the second and third parvocellular layers contribute somehow to red and green vision, and it's suspected that the koniocellular layers have something to do with the color blue, but details are unclear.
Human neuroscience is, for practical reasons, a difficult science. We'd like to study the function of the brain by observing how it acts when it is stimulated in various ways, but such observation is incredibly difficult owing to great health implications, costs, and inconveniences.
For non-human animals, far more is permitted by ethics boards, opening up the latter two options. Whether for better or for worse, it's consequently extremely common for neuroscientific data to be gathered from non-human brains and then extrapolated to human brains. We tend to focus on those animals which seem to be similar to humans in some way, primarily house mice and macaque monkeys.
This obviously poses a huge problem: what is implicitly presented as the functioning of the human brain is actually the functioning of non-human brains; we only occasionally have opportunities to cross-reference, and often only after long periods of time have improved neuroimaging technology. This should be kept in mind whenever we discuss the structure of the brain: our models are complicated blendings of findings from multiple species, not always tied back to human brain operation.

I'm not going to be that epistemically rigorous about this, nor am I going to dig that deeply for controversies to note. (This isn't an official report, after all; I'm just learning about this in my free time, and producing this document as an artifact). Take some of the finer details with a grain of salt—the science may be inaccurate, may have been communicated poorly by primary resources to me, may have been communicated poorly by me to you.
Having been processed in the LGN, visual data is sent to the very back of the brain through one of eight paths which are collectively called the optic radiation. Each path carries the information from a single quadrant of a single eye, sending it to a certain part of the occipital lobe, the lobe of the brain located at the very back of the brain. This part, the primary visual cortex, is the next — and almost certainly the most studied — step in visual processing.
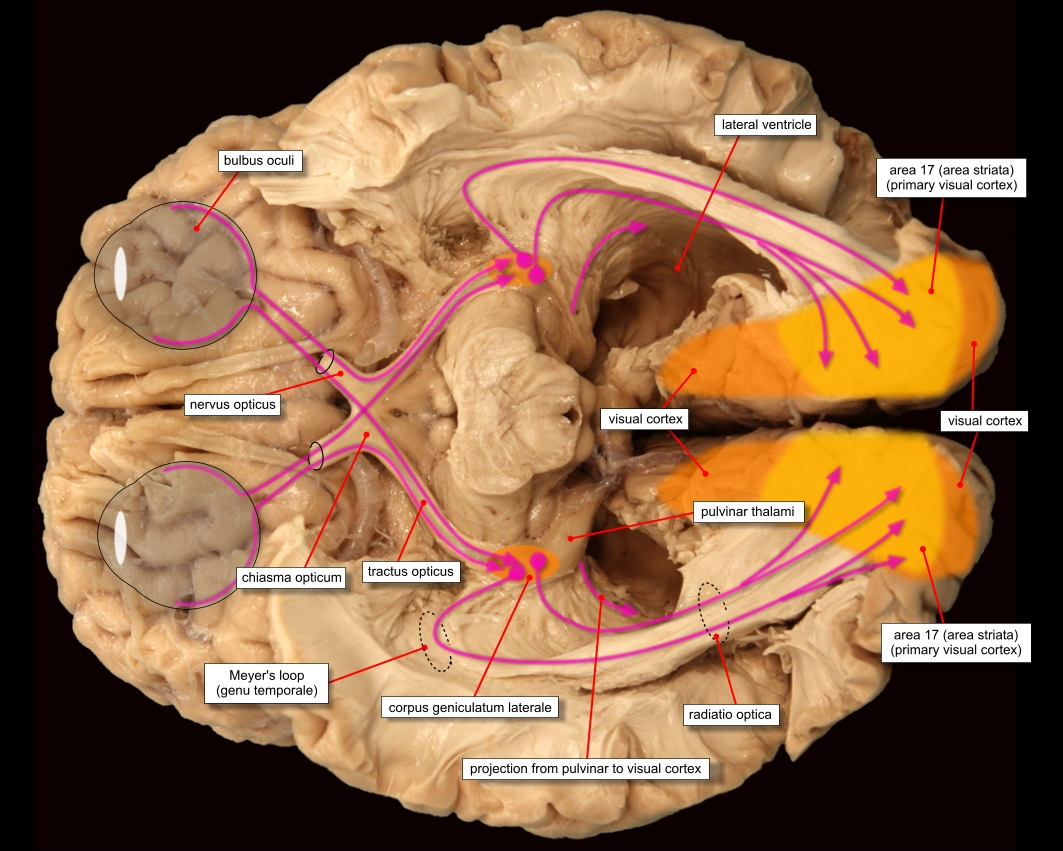
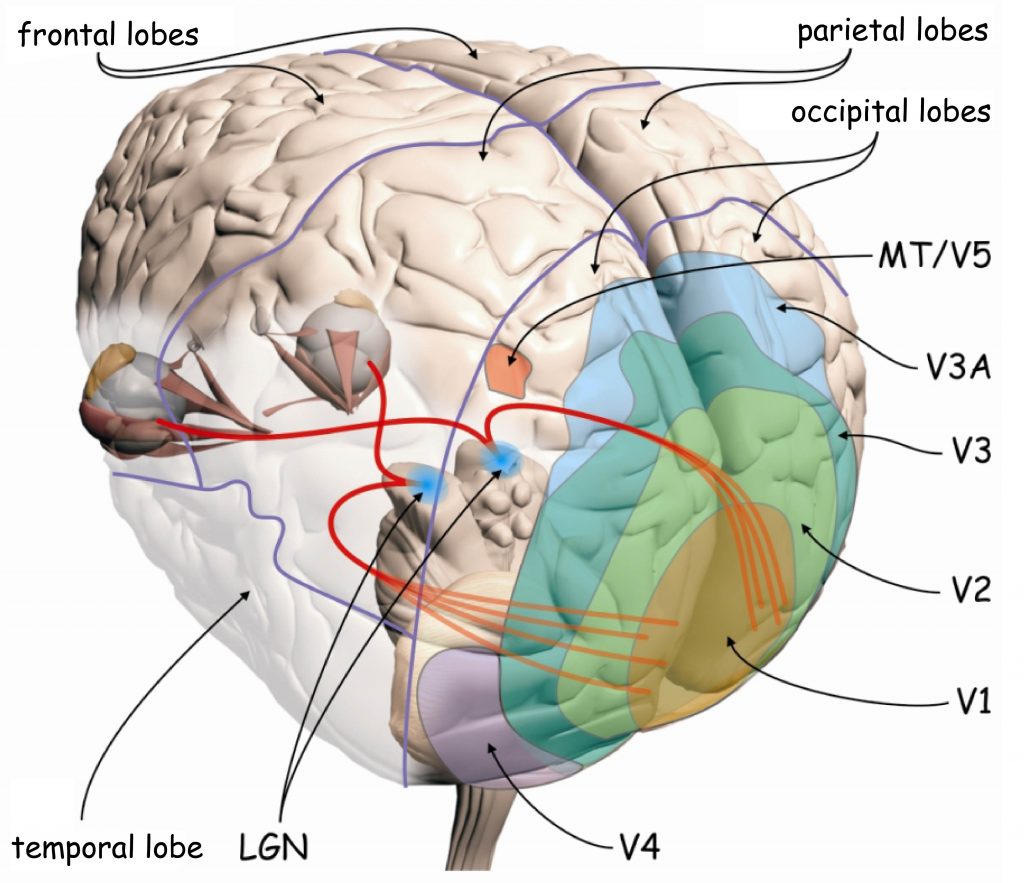
As shown in the above diagram, the optic radius ends at the very back of the occipital lobe, a part of the brain known as the primary visual cortex, or V1.
Entoptic Phenomenon (page gives several examples)
Afterimage and Persistence of Vision
Delboeuf Illusion and Ebbinghaus Illusion
Phi Phenomenon and Beta Movement
Saccadic Suppression of Image Displacement
Flashed Face Distortion Effect
https://en.wikipedia.org/wiki/Interindividual_differences_in_perception
https://en.wikipedia.org/wiki/Efference_copy
In the Iris: The color of the iris is generally what is referred to as eye color, though there's a lot more going on. The primary determinant of iris color is the level of melanin pigmenting the lower of the two layers forming the iris, the iris pigment epithelium. This layer starts off at a light brown, and gets darker as its melanin level increases. There are other pigmentations, such as the yellow lipochrome, but they are rarer.
That some people should have lighter irises is due to scattering of light within the colloidal constitution of the top layer, known as the stroma.
The relevant aspect of the theory of scattering is as follows: When light encounters a particle whose radius is much smaller than its wavelength $\lambda$, it will be scattered more or less randomly in all directions. This scattering randomizes the phases of light waves that hit a given point; the amplitude of a single wave of light will be proportional to $1/\lambda^2$, and the intensity $I$ of interfering waves of light at a given point will be proportional to the squares of the amplitudes of each wave, such that $I \sim O(\lambda^{-4})$.
This phenomenon, known as Rayleigh scattering, implies that scattered light is more intense the shorter its wavelength. This favors violet-blue light, frequency 400-450 nm, to orange-red light, frequency 600-650 nm. When the radii of the particles are only moderately smaller than $\lambda$, and it's called Tyndall scattering, which still has $I \sim O(\lambda^{-4})$. When they are of similar sizes, it's known as Mie scattering, which, while analytically tractable, is extremely complicated.

Thus, when someone has collagen fibers in their stroma which are thin enough that Tyndall scattering applies, their irises will largely absorb red light and reflect blue light — hence, blue eyes.
In the Choroid: The choroid is a layer of the eye that lies directly behind the retina, feeding it nutrients. While rich in melanin, so as to absorb any light that passed through the retina and prevent it from scattering throughout the eye, lots of blood also passes through it to support the retina. Thus, the choroid layer does reflect a small amount of red light, but due to the lensing effects of the eye, this red light generally won't escape through the pupil unless it came in through the direct center of the pupil.
This is the cause of the red-eye effect in flash photography. If an immense amount of white light is flashed at someone looking directly at the source of the light, the choroid will reflect some red light back at the source, so any picture taken from that perspective will see the person's eyes as red. See for instance the owl below, which only has one eye pointing directly at the camera.
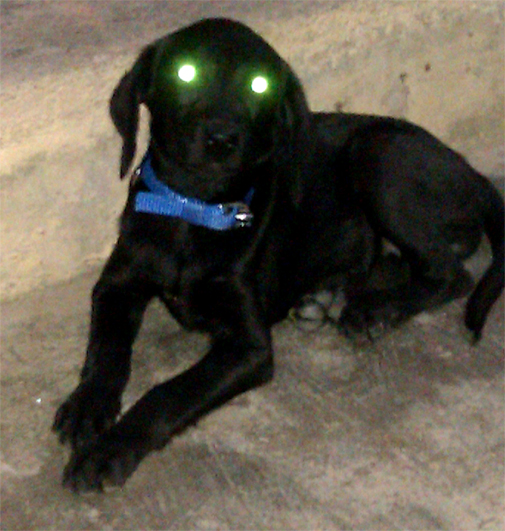
Some animals — not humans — have another layer of highly reflective tissue just below the retina, known as the tapetum lucidum. This reflects some of the light that passes through the retina back at the retina; this massively improves low-light vision, but has the side effect of causing a far stronger reflecting effect, as can be seen in the dog below, or in the cat in this video.

Psychophysics is one of those relics of the experimentally inventive, epistemically questionable, and primarily curiosity-driven explorations of nature characteristic of the 19th and early 20th centuries; named in the year 1860 by the German (pre-)psychologist Gustav Fechner, psychophysics survives in the phenomenological gap between subjective experience and neuroscientific knowledge by empirically studying the relation between physical stimuli and mental perception.
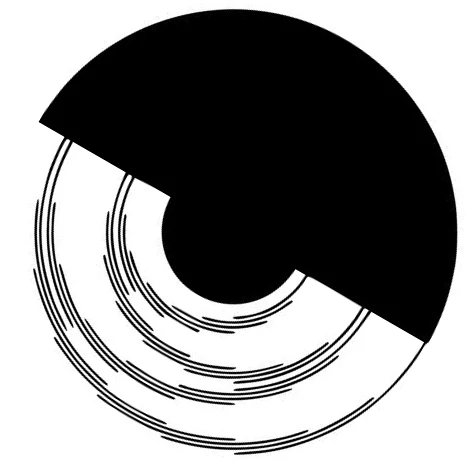
From the very beginning, psychophysics has concerned itself primarily, though not totally, with visual matters; it has still discovered many curious effects which remain unexplained, such as the Fechner color effect, in which rapidly moving patterns containing only black and white appear to have color. Obviously this is a photosensitive epilepsy risk, so click on the image in order to unmask (or re-mask) it.
In this section, we'll look at not only the psychophysics of vision, but the processes for measuring the eye's response to things such as brightness and color.
Objects in our visual field can be said to span certain angles in degrees, just as the US can be said to span 3,000 miles from coast to coast, but the part of the visual field that they cover is known as a solid angle: a rectangle spanning 3° vertically and 5° horizontally in our visual field, for instance, would span 15 square degrees, symbol deg$^2$.
However, it's more common to use steradians, symbol sr: while an arc with the radius of some circle covers 1 radian by definition, giving us $2\pi$ radians in a circle, an object with the area of the squared radius of some circle will cover 1 steradian by definition, giving us $4\pi$ steradians in a circle. Steradians and square degrees measure the same thing, solid angle, but in different units; the conversion ratio from steradians to square degrees is $\left(\frac{360}{2\pi}\right)^2$.
Solid angles aren't just used to parametrize the reception of light, but the emission of it. We define the spectral intensity of a light source as follows:
When discussing how bright things appear to a photosensitive device, whether it be a solar panel or a human eye, spectral flux is often misleading, as receivers often fail to produce signals equally upon reception of equal powers of light at all wavelengths; rather, some wavelengths of light are better at exciting them than others.
For the photovoltaic cells that make up a solar panel, the relative proportion of electrons produced by light of a given wavelength is known as the quantum efficiency; for the human eye, the relative perceived brightness of light of a given wavelength is known as the luminous efficiency of that wavelength.
Luminous efficiency depends on intensity, but this dependence is commonly broken down into three major regimes: photopic, or primarily cone-mediated, luminous efficiency, scotopic, or primarily rod-mediated, luminous efficiency, and mesopic luminous efficiency, mediated by both cones and rods. Because there is an intricate tradeoff between dependence on cones and rods, and because mesopic lighting conditions really aren't all that common, it's common to see only photopic and scotopic efficiency discussed.
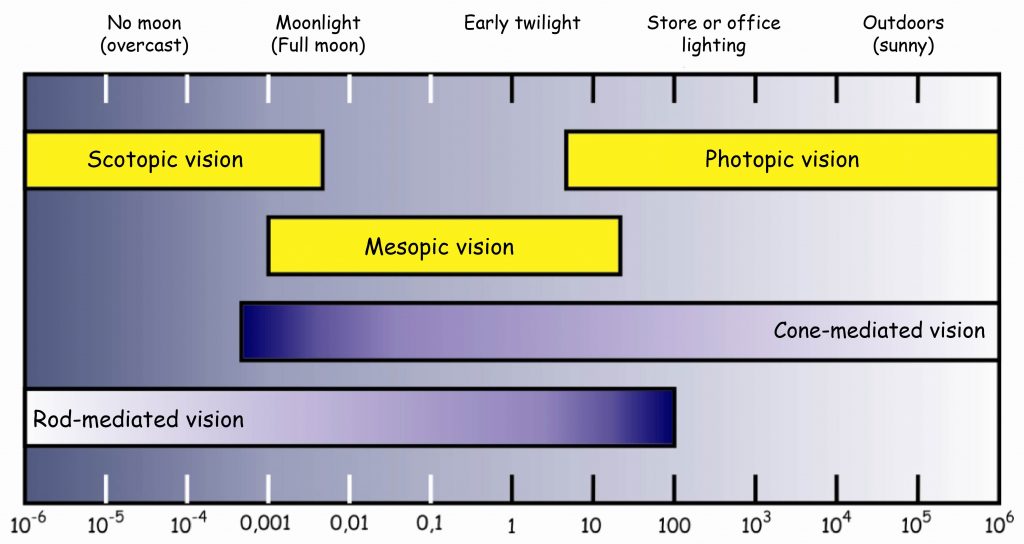
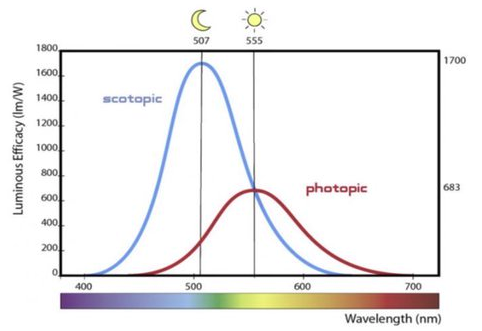
Typically, photopic and scotopic luminous efficiencies are normalized such that they reach a maximum of 1: photopic efficiency is maxed by light with a wavelength of 555 nm, and the photopic efficiency of 555 nm light is therefore defined to be 1; for scotopic efficiency, the corresponding wavelength is 507 nm.
The function sending a wavelength to its (photopic, scotopic) luminous efficiency is known as the (photopic, scotopic) luminosity function $\overline y$; when no brightness regime is mentioned, photopic is generally implied.
Take a light source with a spectral intensity $\Phi_{e, \Omega, \lambda}$; as defined above, this is the derivative of the light energy emitted per second with respect to solid angle, evaluated at a given direction, and then with respect to selected wavelength, evaluated at a specific wavelength $\lambda$. Given a luminosity function $\overline y$, the perceived brightness that source puts out per unit solid angle will be given by $$I_v = K \int_0^\infty \Phi_{e, \Omega,\lambda} \cdot \overline y(\lambda)\, d\lambda$$
where $K$ is a constant with no inherent meaning equal to 683 candela per watt. This value is known as the luminous intensity $I_v$, and this new unit, the candela (cd), is its base unit. The most mysterious of the seven SI base units (the others being s, m, kg, A, K, and mol), the candela is the progenitor of a whole family of units of perceived brightness, all of which normalize in this manner for the luminous efficiency of the human eye.
The above style of equation will come up repeatedly, so we may as well treat it in its general form right away. Possible wavelengths occupy the interval $(0, \infty)$, so the functions which associate each wavelength to a value — whether this be the spectral power of a light source for a variable wavelength, the responsiveness of some kind of cone to a fixed intensity of a variable wavelength, the reflectivity of an object to a variable wavelength, or something else — are functions $(0, \infty) \to \mathbb R$.
These functions form a vector space through the operations of pointwise addition and multiplication; even better, they form a Hilbert space, bearing an inner product from which a measurement of distance can be derived. An inner product is a method for combining two points $a, b$ in a vector space to get a real number $r = \langle a, b\rangle$, and the inner product for Hilbert spaces of functions is generally given by integration of their pointwise product. In particular, the inner product over the Hilbert space of functions $(0, \infty) \to \mathbb R$ is given by $$\langle f, g \rangle := \int_0^\infty f(\lambda)g(\lambda)\, d\lambda$$
For instance, if we write $\Phi_{e, \Omega}(\lambda) := \Phi_{e, \Omega, \lambda}$, then we may simplify the above definition of the luminous intensity to $I_v := K\langle \Phi_{e, \Omega}, \overline y\rangle$. (There are some technicalities I've glossed over re Hilbert spaces, but they won't show up).
While its symbol doesn't indicate it, the luminous intensity is dependent on a choice of direction; integrating the luminous intensity over all directions gives us the radiant flux analogue of the luminous intensity, the luminous flux; its unit is the cd sr, also known as the lumen) (lm).
Since a small object emitting a certain amount of light will seem much brighter than a large object emitting that same amount of light, there should be some measure of light which takes surface area into account. As such, we define the luminance $L_v$ of a surface to be the derivative of luminous intensity with respect to area; its unit is the candela per meter squared. Note that it already takes the solid angle of the visual field into account.
Since humans have three different photoreceptors capable of discriminating between wavelengths, and the phenomenological experience of color is given by the combination of the intensities of the signals produced by these photoreceptors, a color is not a wavelength, but instead a compressed version of the spectral power distribution $M(\lambda) = \Phi_{e, \lambda}$ of the source emitting (or reflecting) the light perceived as having that color. A parametrization of the space of colors humans can see, whether to describe or to recreate colors, is known as a color space.
Since the space of spectral power distributions is infinite-dimensional, while the space of perceivable colors is at best three-dimensional, the map from SPDs to colors will be deficient, often mapping different distributions to the same perceived colors; two SPDs which yield the same color are known as metamers) of one another. Interestingly enough, this is a major problem in the design of colored things such as paints, as two metameric paints which seem to have the same color under one light source may seem to have different colors under another light source.
It was hypothesized as far back as 1802, long before the actual discovery of cones, that there were three kinds of receptors in the human eye each capable of responding differentially to different wavelengths of light, thereby giving us color vision. At first it was thought that these receptors optimized for red, green, and blue light; only near the end of the 20th century did it become clear that the situation is more complicated, involving opponent processes.
Some common color spaces in use today are those developed by the International Commission on Illumination (acronym CIE b/c French) in 1931, generally known as the CIE 1931 color spaces. Other color spaces have been developed since, such as the LMS color space, which, being named after the (L)ong, (M)edium, and (S)hort-wavelength receiving cones of the human eye, attempts to directly represent colors in terms of their stimulation of these three kinds of cones. The CIE's 1931 work also gave us the luminosity functions above.
One of the color spaces developed by CIE in 1931 was the CIE RGB color space.
The first step in this approach was figuring out how to represent each individual wavelength in terms of a combination of red, green, and blue. Their approach was empirical: to get the red, green, and blue values corresponding to a certain color, project a wavelength in one half of the visual field of the fovea, and, in the other fovea, put a spot illuminated by red, green, and blue lights; the observer adjusts the powers of these three lamps until a (perceptual) match is found, and mark the the final values of the powers as as the red, green, and blue values corresponding to that wavelength. Here, the blue and green lights, coming from the spectrum of mercury, were 435.8 and 546.1 nm, respectively, while the red line was 700 nm.
Some projected wavelengths were impossible to reproduce with these three wavelengths, but were possible to reproduce if an adjustable lamp of one particular color was added to the projection; in such cases, the intensity of this lamp was thought of as a negative value.
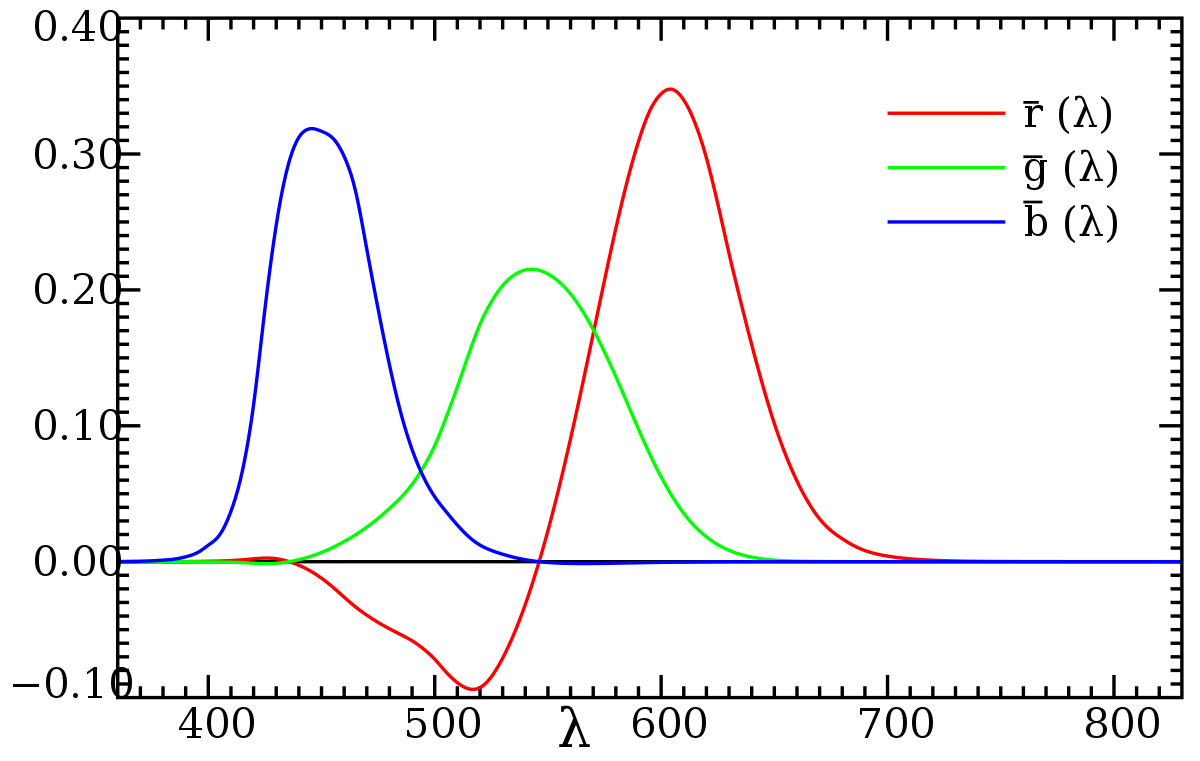
Doing this for a great variety of wavelengths, and interpolating to get the rest, the CIE developed three color matching functions $\overline r(\lambda), \overline g(\lambda), \overline b(\lambda)$. The negative range of $\overline r$ is clearly visible, but $\overline g$ and $\overline b$ also have very small negative ranges around 430 and 570 nm, respectively.
With these matching functions, the next step was to use these functions to assign red, green, and blue values to arbitrary spectral power distributions. This is done via the inner product: for a given object with SPD $M(\lambda)$, we define the red value of that object as $R = \langle M, \overline r\rangle = \int_0^\infty M(\lambda)\overline r(\lambda)\, d\lambda$, and likewise for the green value $G$ and blue value $B$. Plotting these values for all colors perceivable to the human eye gives us the CIE RGB color space.
If you want to use red, green, and blue lights to recreate a given color which has a negative RGB value — sky blue, for instance — you're out of luck. You just can't. However, almost all colors which have negative values for some base color can be closely approximated by combining the other base color, so the situation isn't that bad. Many color spaces in use for RGB displays, such as computer monitors, use such a mapping from colors to activation values in the range $[0, 1]$ in order to adjust the intensity of red, green, and blue lights throughout that display. These RGB color spaces are generally plotted in comparison to the CIE XYZ color space, a linear transformation of the CIE RGB space which has only non-negative values.
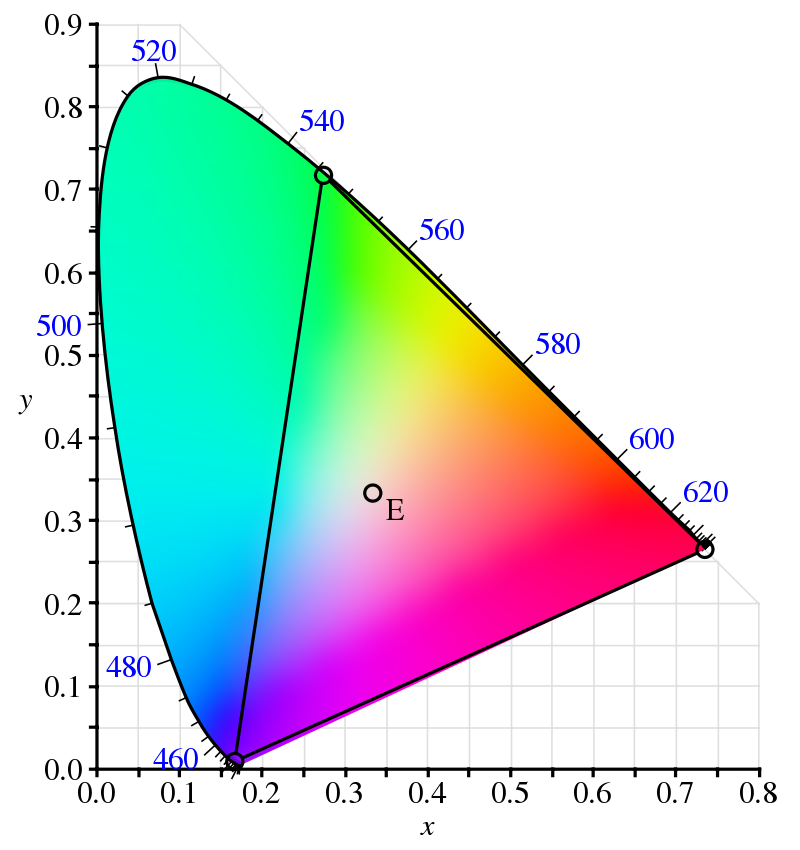
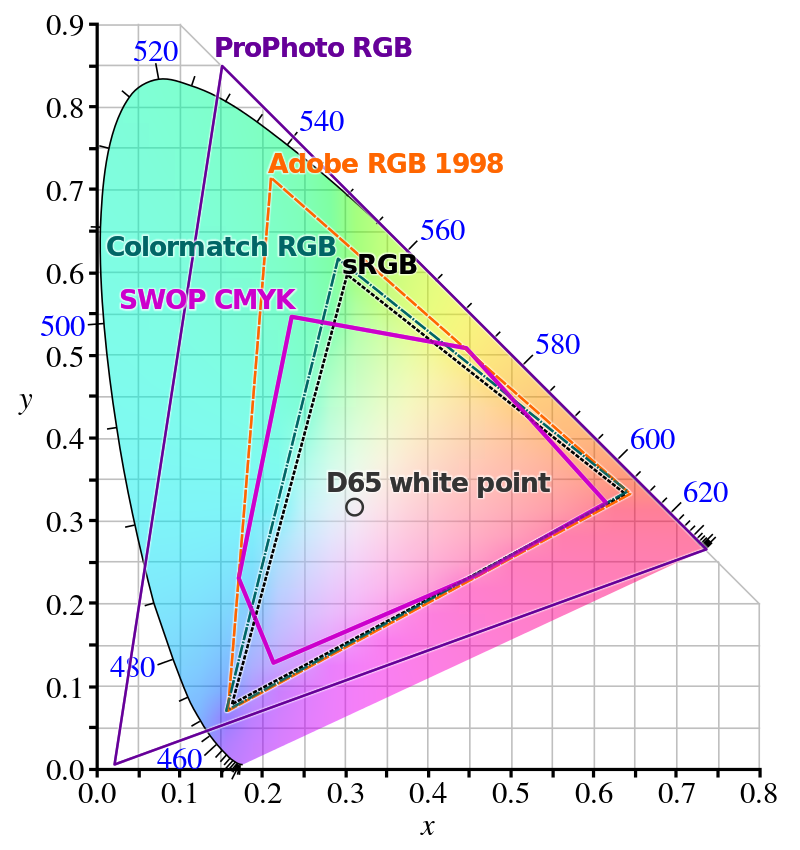
Many different color spaces overlaid on the CIE XYZ color space. One drawback of ProPhoto's massive color space is its extension beyond the space, and therefore beyond human vision. Points in this region are known as impossible colors, and are just incoherent. (Source).